


Tableau is a visualizing platform that performs analytics with tools by providing raw data. Users can make Tableau reports, creating Business Analysis. Tableau also provides 5 certification courses. Explain Functionality There are different version of Tableau available in the market if you want a free version can install the Tableau Public version also can buy the Tableau Desktop version which will cost 100$. Installation of the Tableau is pretty straightforward and you can download Tableau Public version.
Table of Contents
Whats the difference between Tableau Public & Desktop Software?
| Features | Tableau Desktop | Public | Tableau Reader |
|---|---|---|---|
| Creating visualization | |||
| Connecting all Data source | Only Excel, Text files | ||
| Visibility Management | Need to provide Access | All reports will be public | Need to Provide Access |
| Pricing | $999 – $1999 | Free | Free |
Getting Start with Tableau
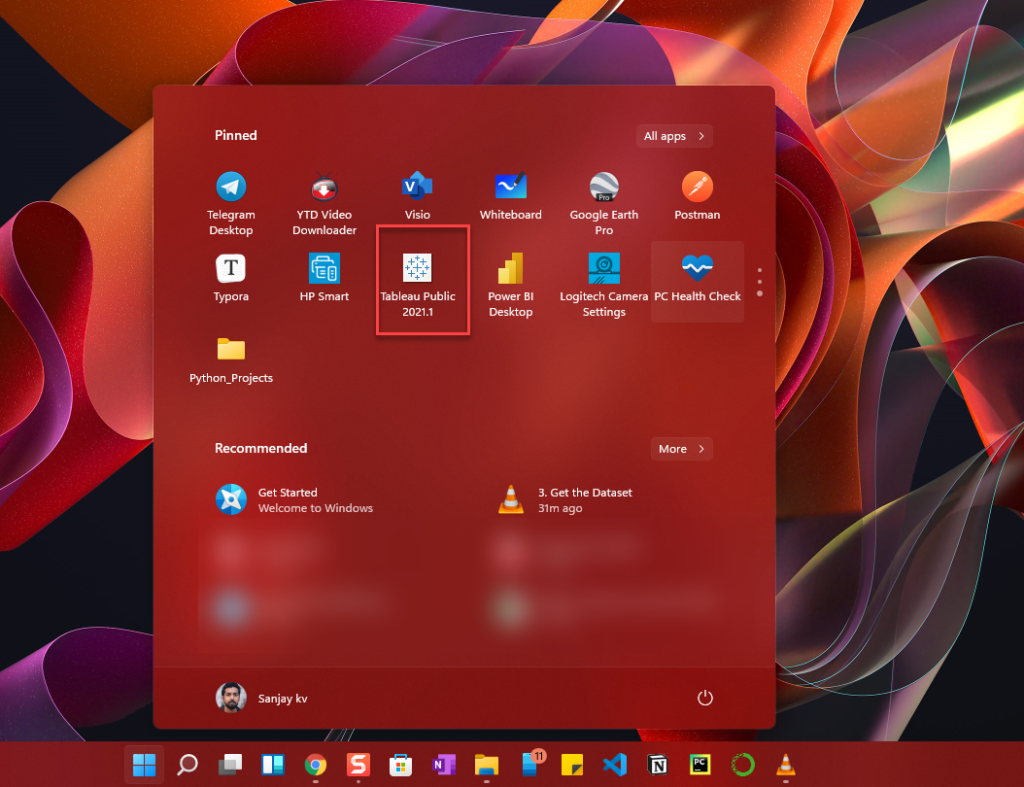
Step 1: Install the Tableau Public software the latest version of this software is Tableau public 2021.1. Open the Tableau to perform basic operations like fetching the file and do a sample visualization and saving it to the public server.
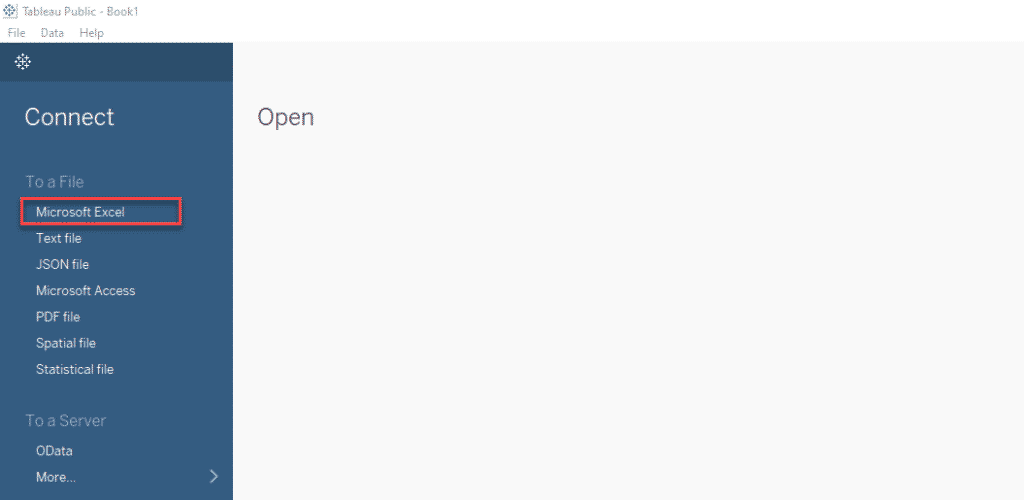
Step 2: To fetch the file (Raw Data) can click on any of the options highlighted on the left pane depends upon the file type, here I’m importing the Excel file or drag and drop the file to the white space on the right.
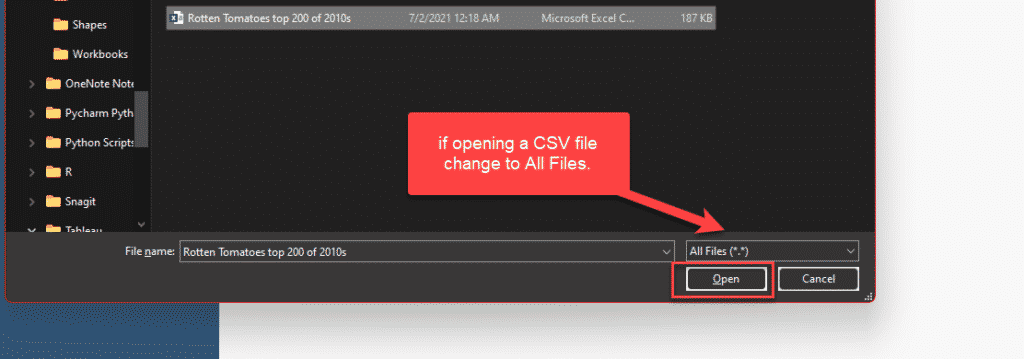
Step 3: If you are opening the CSV file sometimes the files won’t show in the window, make sure that you change the format to select All Files. This is an optional step, I recommend to do drag and drop the files as that’s a pretty time-saving process.
Step 4: Depending upon the worksheet in excel you can see similar tabs appearing. The Excel which I used only has one sheet. The file I used is Rotten Tomatoes Movie analysis data.
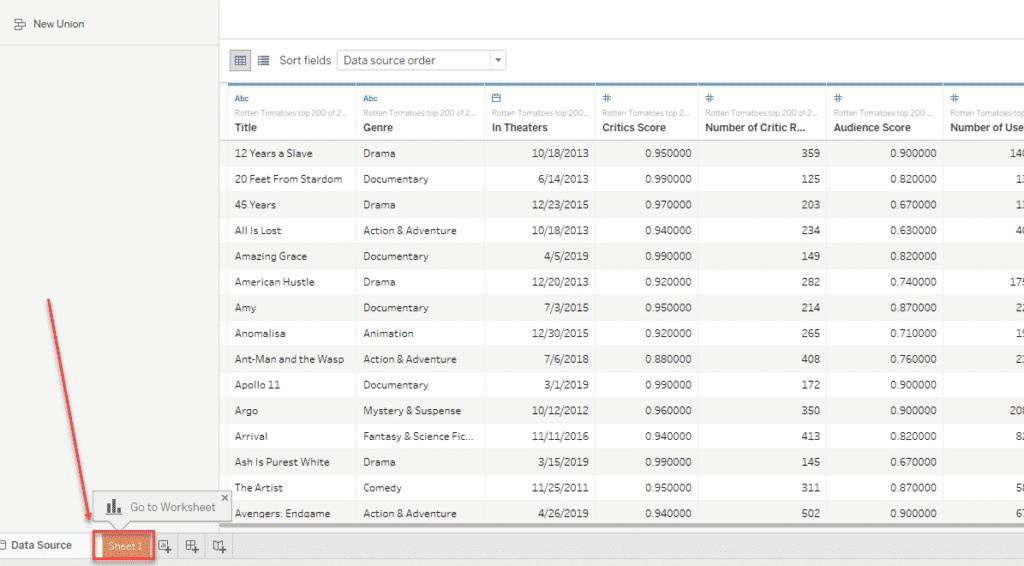
Step 5: Click on Sheet 1 to view your Workspace, this is the place where you make the visualization happen, Now tableau windows open up you can get the dataset below.
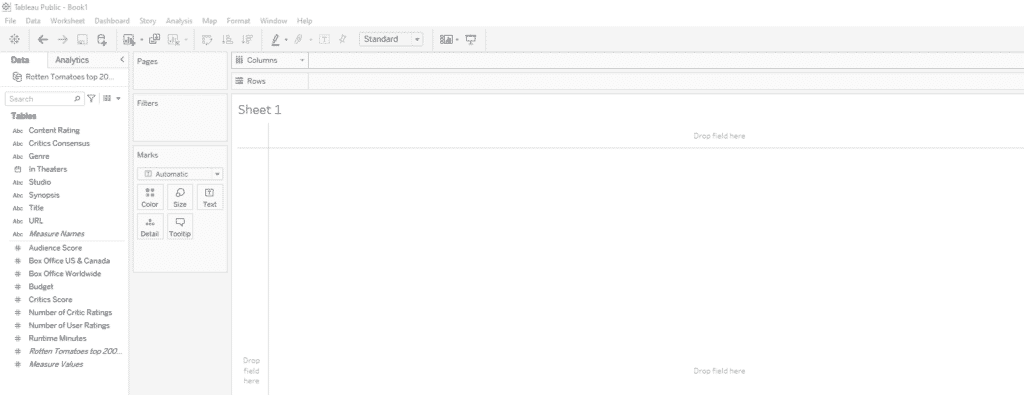
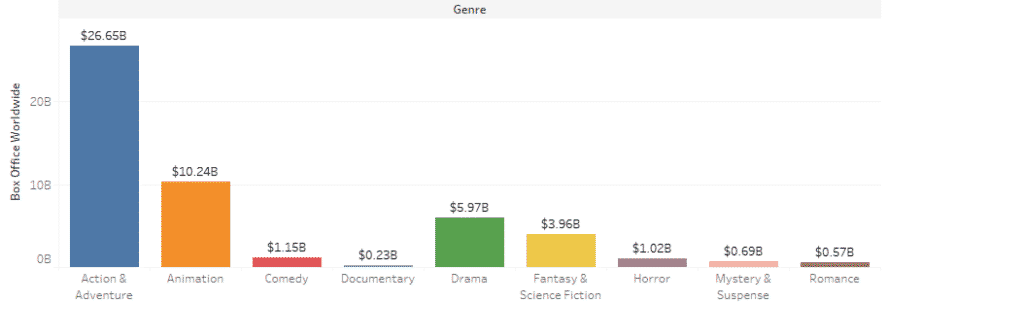
Step 6: What we going to do is to get a breakdown of movies by genre and how much amount the movie made Boxoffice worldwide. So drag and drop the genre to column and Box office sum to Rows. The procedure if you try to visualize using python and matplotlib library will be a time-consuming process.
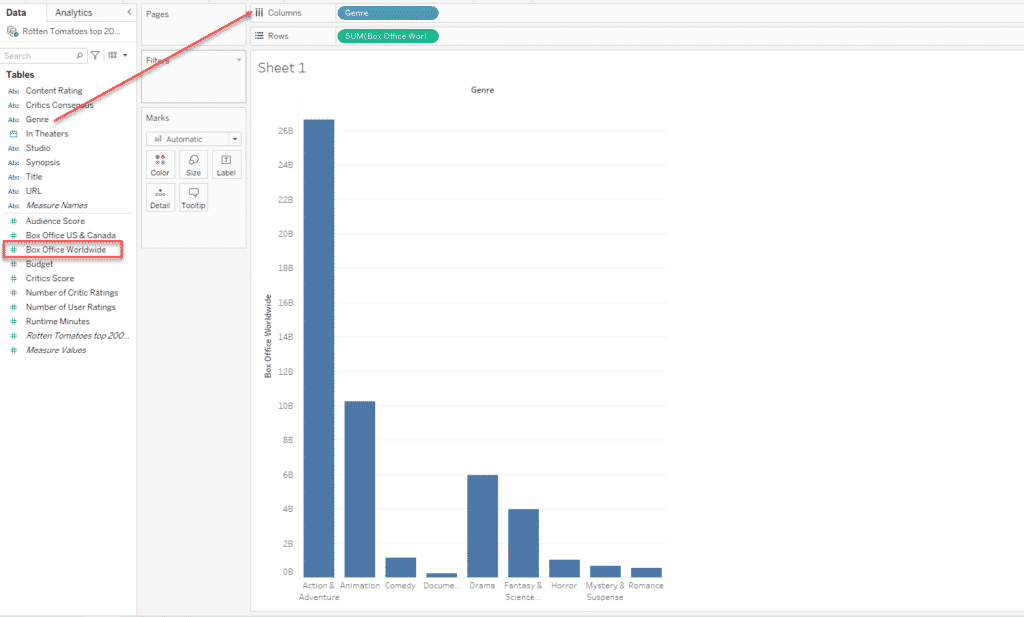
Step 6: (Optional Step) By default the graph will be pretty big in size and not appealing for the user to see the visualization, so there is a way to adjust the graph size in Tableau drag and drop the edges. The same has been shown below.
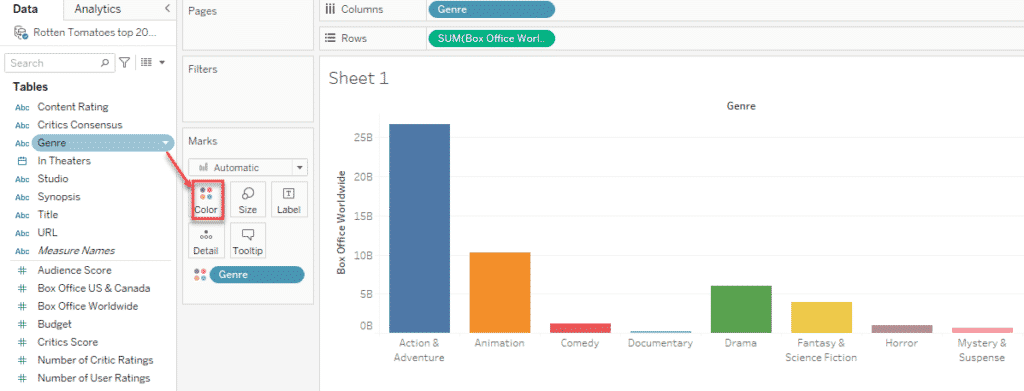
How to Add color to Bar chart in Tableau
Step 7: It’s a very simple process, you can see all the columns on the left panel under Table section, drag and drop those col to the color as shown below. This will automatically assign a color to the chart on the workspace.
How to Add Labels to a chart in Tableau
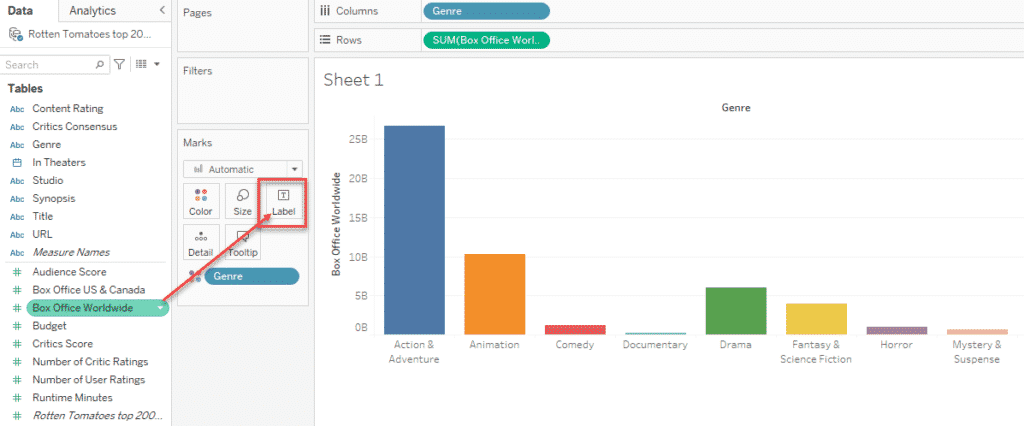
Step 8: Here I need to show the amount collected worldwide representing each column. Same as how we assigned the color to the chart we will drag and drop the respected row to Label.
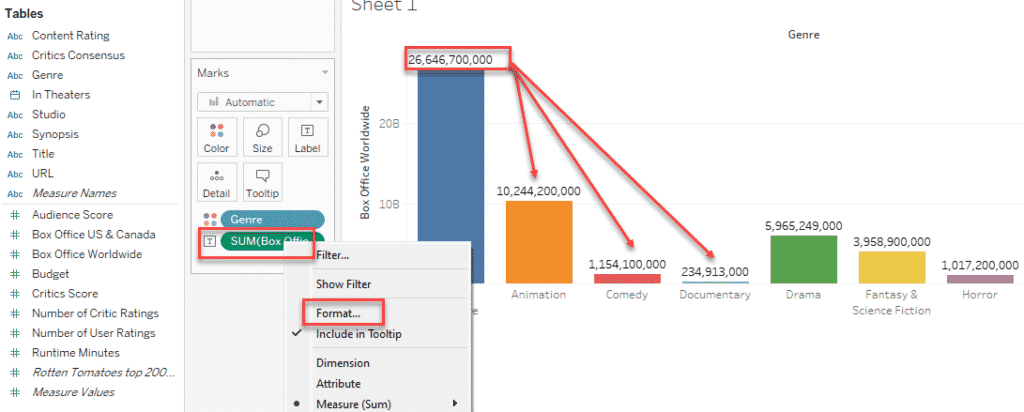
Step 9: Now will look into how to customize a label in Tableau. Here in this scenario I can see the label is appearing, but this is again not appealing to a user, I don’t want to read such a big number as a Data Analyst we have to make the data to be the present more readable format.
For this right-click, on the Box office row the label,click on the format this will open a small window with more customization tools.
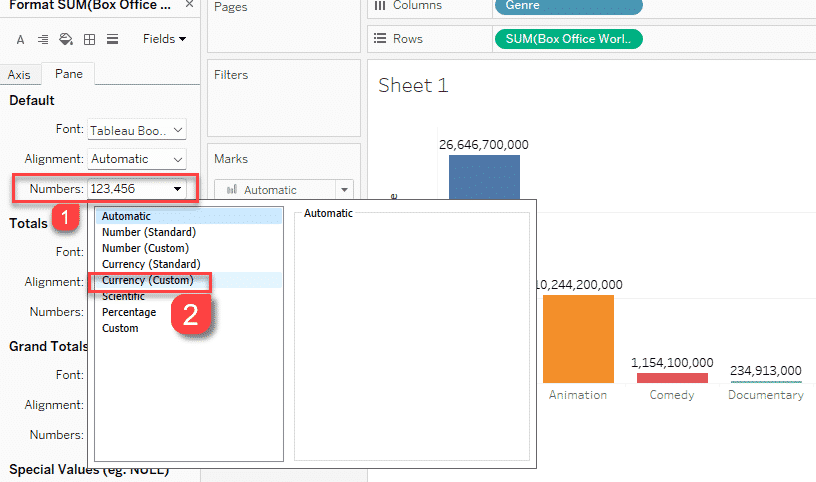
Step 10: Click on Numbers and select the currency.
Step 10: Now this has been converted from Numbers to Currency format to make it more readable we will convert the display unit to Billions as shown below.
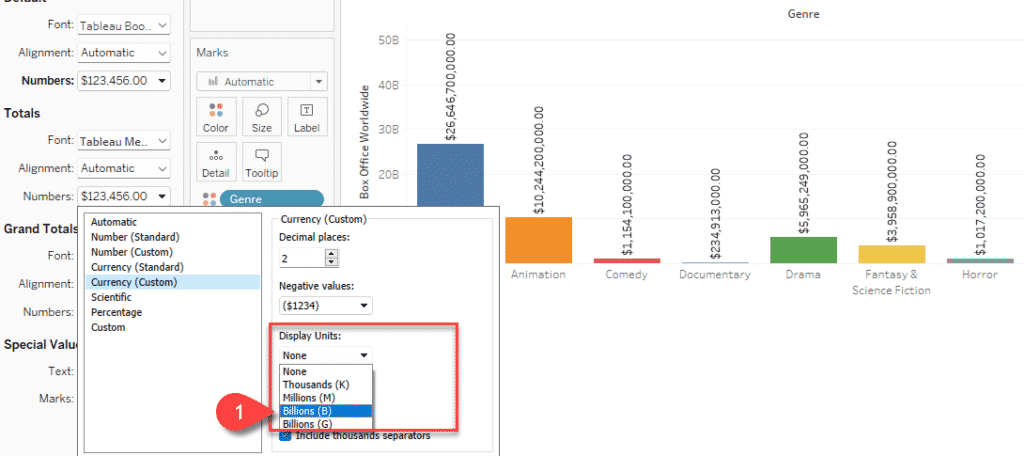
Now your chart will look like, which makes it more readable with Genre and the worldwide collection as well.
How to Save the Tableau Visualisation
As mentioned above if you don’t have a Tableau desktop version, saving tableau files to your system is not possible, if using Tableau public version you can save directly to the public server and it will be available 24×7 and by the user, the requirement can change the visibility of the report to public or private.
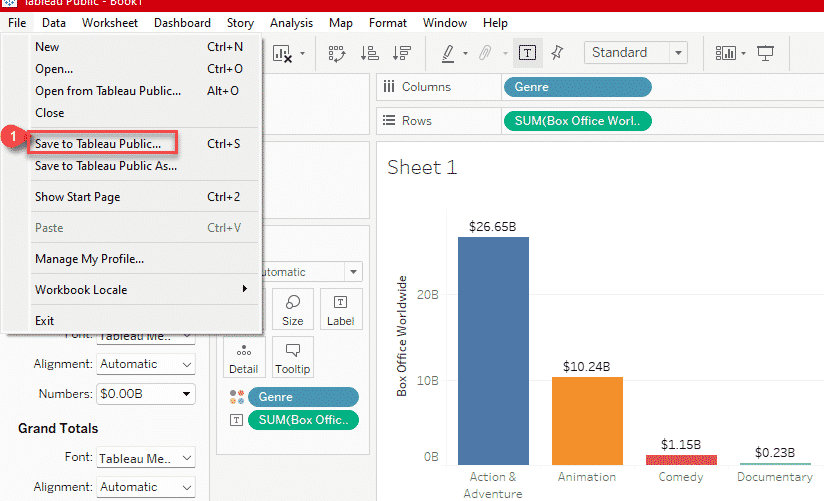
Step 11: To save a file to Tableau public server Click on File Menu and save it to Tableau public.
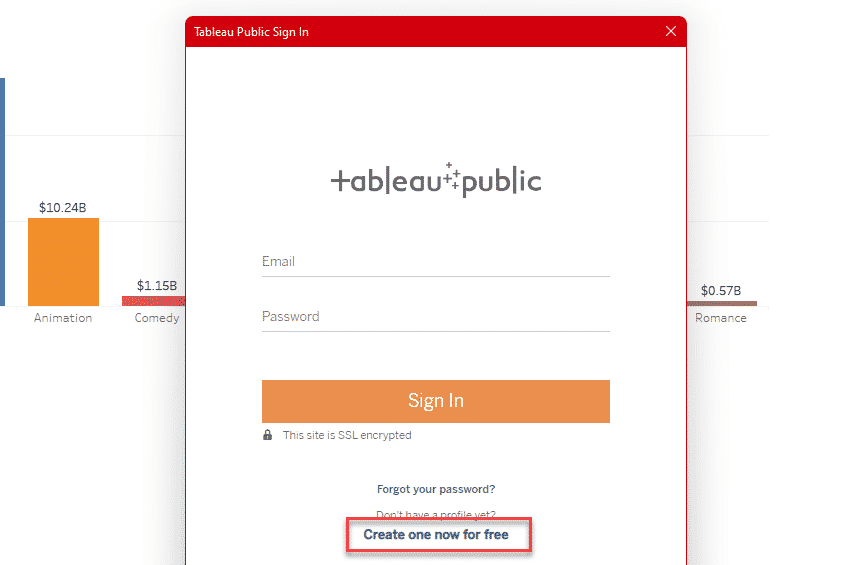
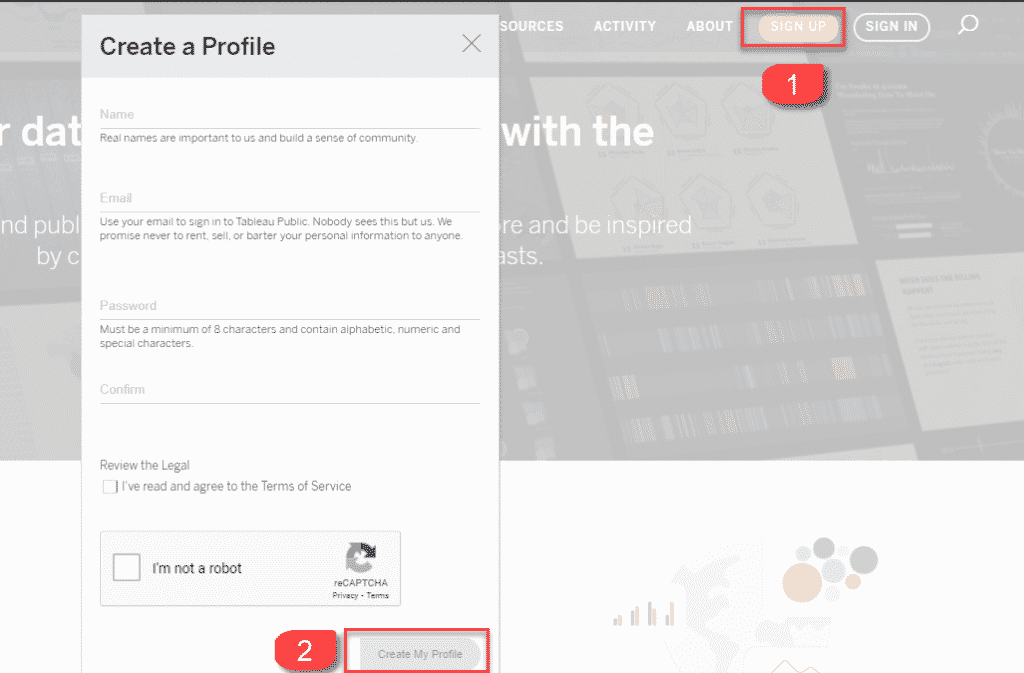
Step 12: This will ask your username and password to sign in, If you don’t have an account recommend you to signup. To signup click on Create one now for free button.
Step 13: In most cases, the above signup will take time. If this is not working I recommend, you may require to verify the profile via email verification to complete the registration on the tableau official website.
Once you save the file to the server this is how it looks like, you can click here to see my visualization
Listing Few best Tableau Authors and Profile links Below:
- Damola Ladipo : Profile Link
- James Strachan: Profile Link
- Kasia Gasiewska: Profile Link
FINAL VERDICT :
In conclusion, I hope you enjoyed reading this article on “How to start with Tableau- Beginner Tutorial”, Next post deals with Handling different types of charts in Tableau. Check out that post and let our team know what Tableau Tutorial you expect next. Signing off sanjay@recodehive.com