


Table of Contents
Understanding Data Visualization
Before proceeding with creating a Google Data studio report we need to analyze the scope of Data Visualization and existing alternatives in the Market also need to look at why Google Datastudio can really help you to save a lot of bugs. If you are a marketer or freelance marketer, Google Data Studio might help you to save lots of money. Google Provide Free Data Studio Course.
Understanding Google Data Studio
When comes to Data Visualization there are already marketing leading tools exist like Power BI, Tableau, Snowflakes, Informatica. The sad part if all are required to get the paid version to use the maximum productivity out of it. Here comes the Google Data Studio and it’s completely free.
Some of the features of Google Data Studio are the following. The Data studio lives in the cloud, anyone can use and access it from the cloud. You can use a template or create one your own. It can load data from Google Analytics, Google ads, CSV, etc. Once you connect these above accounts data will be uploaded manually. Easy free customization visualization for your business needs. But the Development feature is limited, you may not able to perform the DAX kinda features of PowerBI in Google Data Studio.
Data Visualization basics
Before moving to the reports you need to understand the basics of reports which are Dimensions, metrics, values. Dimensions are kind of categories Values to include names, date Metrics will measure whatever in the dimensions it can me count, sums, and ratios.
What are Reports in Data Visualization?
The report is the place where you create, A data set is a collection of information you organized under one frame whereas we define charts as a single component of a report that shows metrics
| No | Label | Description | QTY |
|---|---|---|---|
| 1 | Mouse | Wireless | 20 |
| 2 | Keyboard | Wireless | 30 |
| 3 | Monitor | Touch Display | 40 |
Create a report in Google Data Studio
To get started with Data Studio you need to sign up with a Google account.
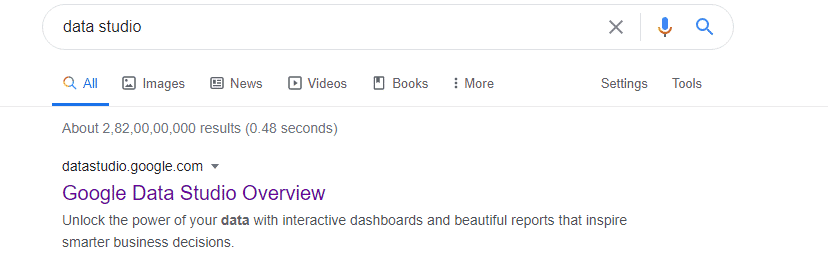
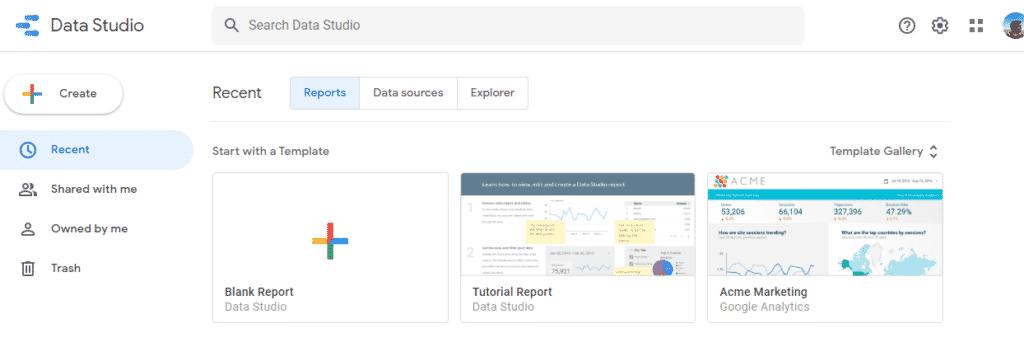
Step 1: Go to datastudio.google.com or search “Google Data Studio” in google and click on the first link. Now it’s time to connect your Data Source to make Data set through connectors can say Data Source to be Google Analytics. and connector is kinda Authentication which makes it possible to fetch the data and make the Data set.
So what you can do if you want to import data from another source that the connector doesn’t support. You can download it in CSV and upload it to Google Data Studio.
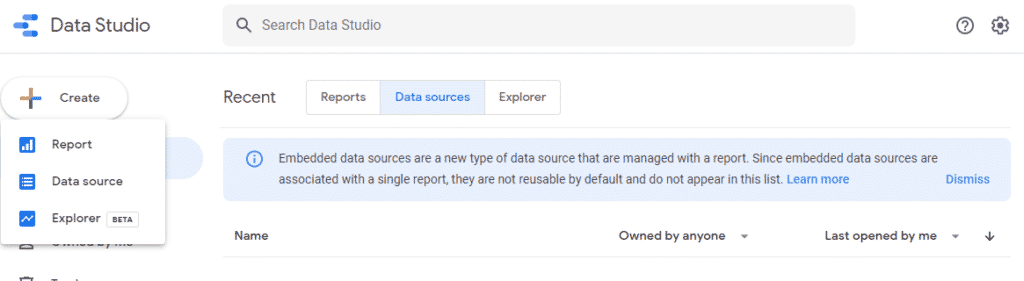
Step 2: To create Report click on the + icon and create a blank report or else expand the template Gallery and click on any existing template. For more details on the Existing template, you can refer to the related post below.
Connecting Data Sources with Google Analytics, Youtube reports.
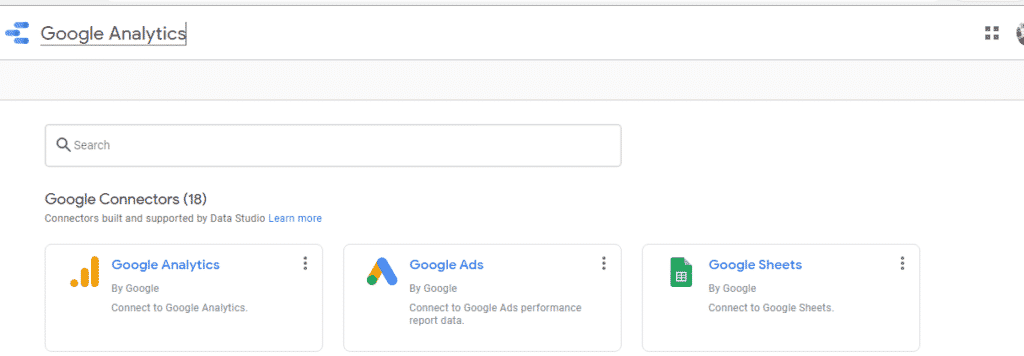
Step 3: Click Data Sources, and agree to the terms and conditions then select the country you live in on the next tab then at the end click the data source you want to connect. There are 18 Data connect source available. Select one and continue.
Step 4: In my case, I’m using Google Analytics to connect with my Data Studio and going to make a report I want to see and share with my team.
Step 5: Click on Authorize on next screen
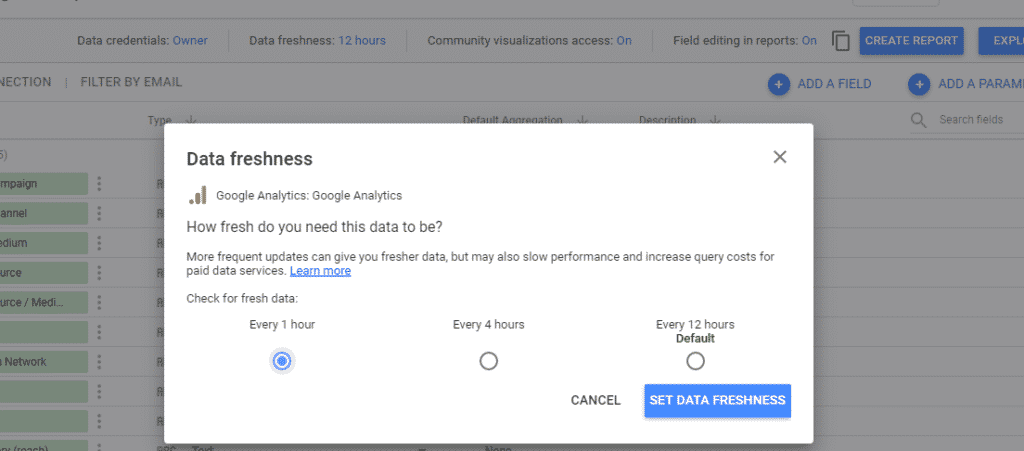
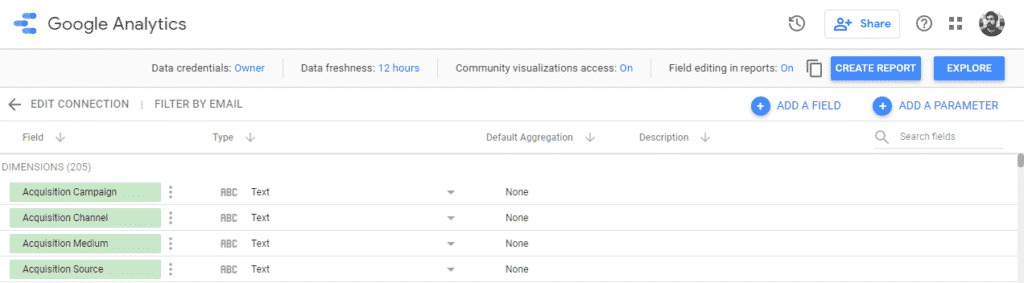
Step 6: On the top, you might find a screen called Data Freshness where you can decide the time where the data update frequency from Google analytics to your window.
Step 7: Now select the view and click on connect on top right and you can change the type of data structure from the sheet. Once you done that click on Create Report.
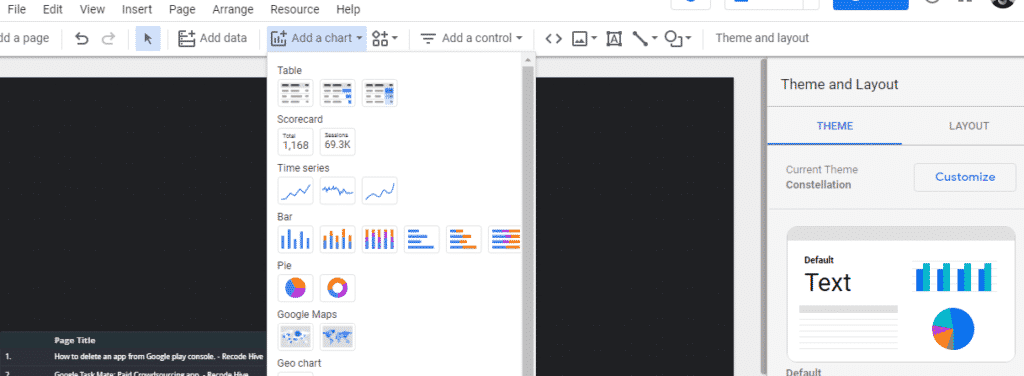
Step 8: Click on create a report on the right side, you can select a theme from the right side. Give a proper title, then click on the add a chart button and click on the chart you want to import.
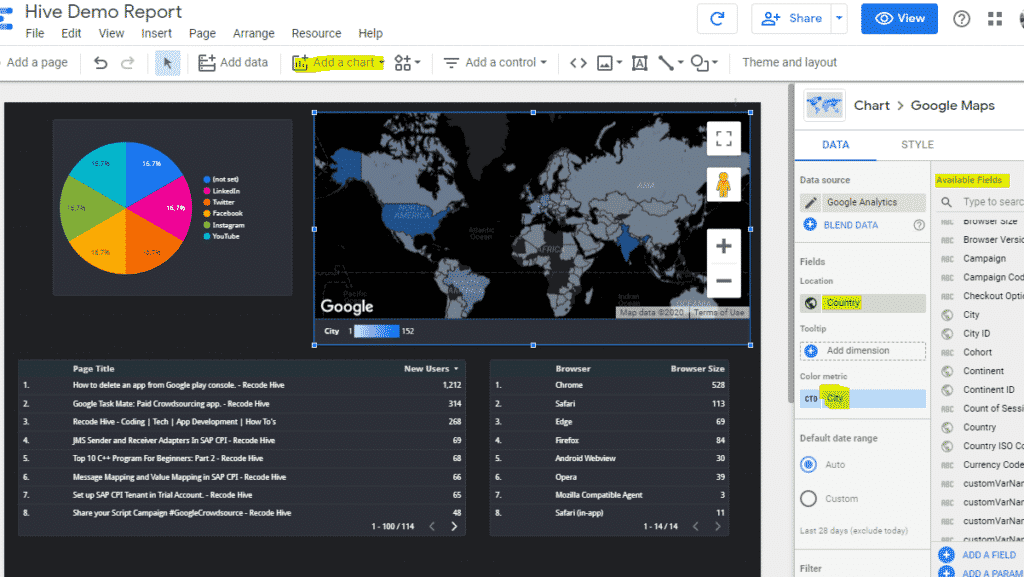
Step 9: Similarly add the details like this, and try to make a dashboard with all necessary charts on the right side you add the metrics.
Sharing the report
there are multiple ways to share the report ways which as Permissions and credentials, Credentials make or restrict the report seen by other people, you can even set the visibility. Credentials help to see who has the visibility inside the reports. There can be only one owner.
FINAL VERDICT :
In conclusion, I hope you enjoyed reading this article on “Create a report using Google Data Studio”. In the next post, you will be able to see the real time implementation youtube dashboard in Google Data Studio. Signing off Sanjay Kv