


In the previous Tutorial, you got to learn how to begin with Tableau and a small demo on creating a histogram and heatmap Here we will visualize how many minutes each movie runs for later visualize how many movies ran more than 90 -120 minutes. Let’s look at how it is working with Treemaps in Tableau.
TREEMAPS
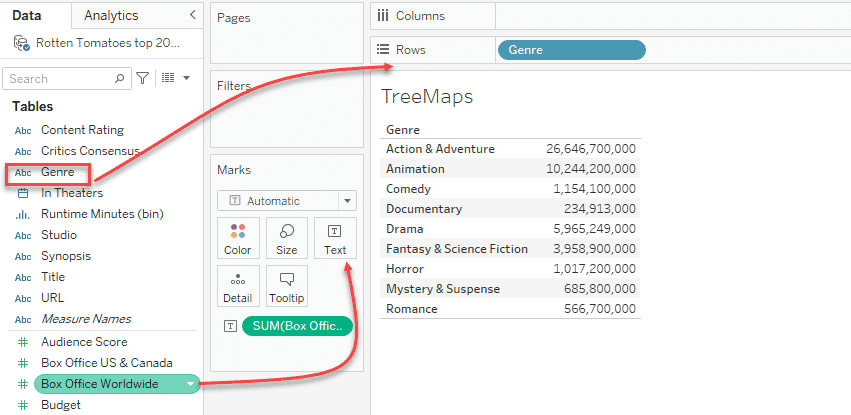
Treemap when you implement it looks somewhat similar to Boxplots, but it gives us a hierarchical view of the Data present. To get a brief view of the data we do the below step which gets data of Box office worldwide collection based on genre,
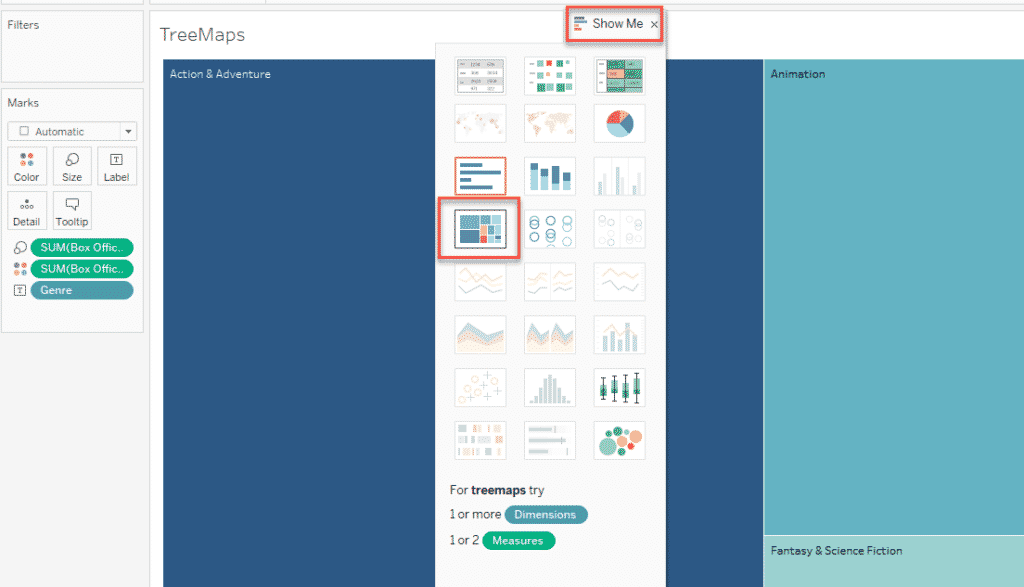
The fastest way is to create a treemap from the above step is by clicking the show-me function (mostly appear on the right-hand side of your Tableau screen) and select the option Treemap from it.
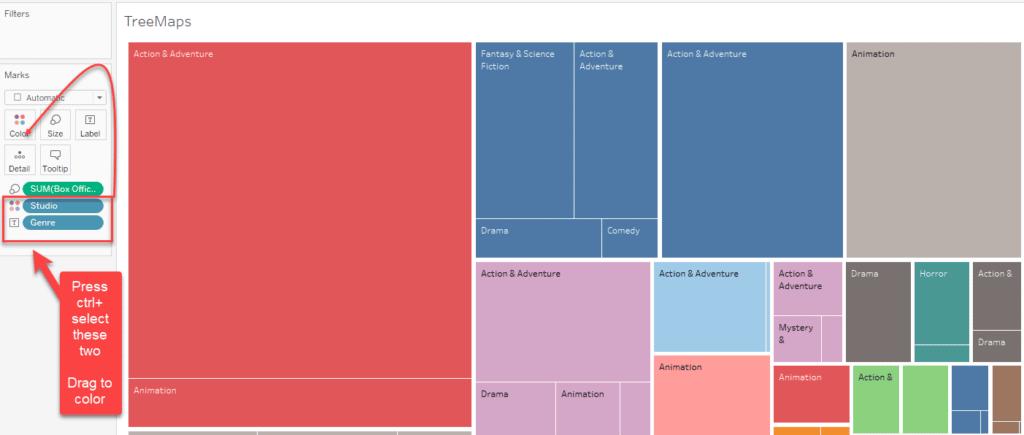
Now let’s explore the scenario in which you need to group by color based on Genre, Select both Studio and Genre from the control panel Dont leave the control when you drag and drop to the color.
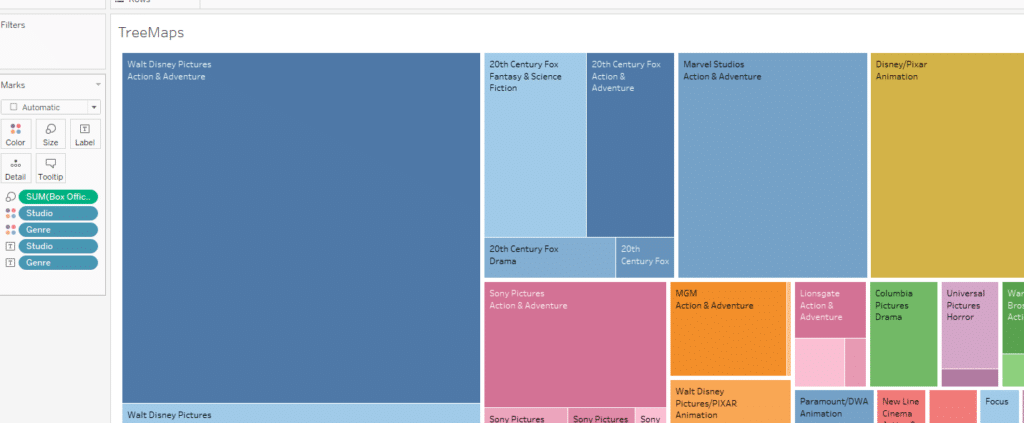
This is how it looks like once you drag and drop the Studio and Genre to the color., The big one is the Tree branch and the smaller rectangles beneath is the sub branch.
FINAL VERDICT :
In conclusion, I hope you enjoyed reading this article on “Working with Treemaps in Tableau”, Next post deals with Handling different types of charts in Tableau. Check out that post and let our team know what Tableau Tutorial you expect next. Signing off sanjay@recodehive.com